

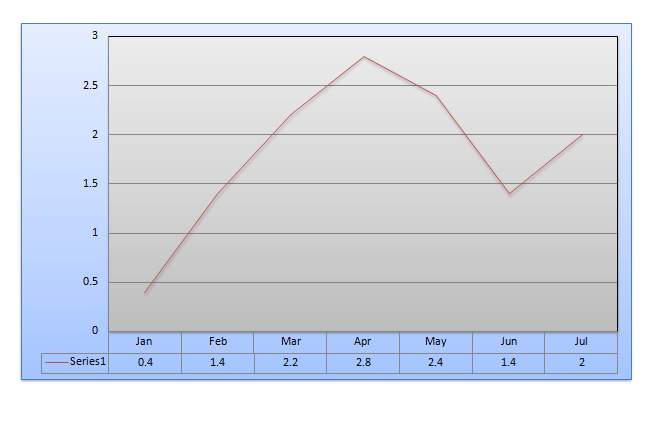
Directions (Q. Nos. 1-4) Refer to the following line graph which represents the rainfall in- inches during the months of January through July in a particular year in a certain city
In each of these questions, two
quantities are given, one in and one in .
Compare the two quantities.
Mark answer as
(a) If the two quantities are equal
(b) If the quantity in is greater
(c) If the quantity in is greater
(d) If the relationship cannot be determined from the information given
Mark answer as
(a) If the two quantities are equal
(b) If the quantity in is greater
(c) If the quantity in is greater
(d) If the relationship cannot be determined from the information given
|
1. 1. The ratio of rainfall in the
months of February and July
|
2 : 3
|
|
2. The average monthly Rainfall
recorded for the 7 months
|
1.9 inches
|
|
3. 25/2%
of all the rain that fell during the 7 months period
|
The amount of rainfall during the
month of February
|
|
4. The
ratio between the rainfall in May and January
|
The
ratio between the rainfall in April and February
|
Answers
and Explanations:
|
Month
|
Rainfall
|
|
January
|
0.4
|
|
February
|
1.4
|
|
March
|
2.2
|
|
April
|
2.8
|
|
May
|
2.4
|
|
June
|
1.4
|
|
July
|
2.0
|
|
Total
|
12.6
|
Answer 1: (c)
The ratio of rainfall in Feb : July = 1.4/2.0= 0.7:1 . The
value of is 2:3 = 0.67 : 1 . Since the
value in is more than B, the correct
option is (c)
Answer 2: (b)
The average annual rainfall is 12.6/7 = 1.8 ins which is
less than 1.9 inch. Since the value in is more Than A, the correct option is (b)
Answer 3: (c)Total rainfall in 7 months=
12.6= 12121212 =25×12.6200=25×12.6200= 1.575 inch
The amount of rainfall during the
month of February = 1.4 inch
The value of the is more.
Therefore the correct option is (c).
Answer 4: (c)
Ratio of rainfall in May: January :
2.4:0.4 = 6:1
Ratio of rainfall in April :
February : 2.8:1.4 = 2:1
The ratio of is more than the ratio of .
Therefore correct option is (c)


No comments:
Post a Comment