New- REET VACANCY COMING SOON: 31K Posts of 3rd Grade Teacher in Rajasthan(Approved by FMoR) New- RSMSSB PATWAR: Exam in January, 2021
Showing posts with label DATA ANALYSIS. Show all posts

Wednesday, December 27, 2017

Quantitative Aptitude: Inequalities Quiz

Dear Readers,


  1. Quantity I: The age of teacher, if the average age of 36 students is 14. When teacher’s age is included the average increases by 1.
    Quantity II: The age of teacher, if the average age of 19 students is 35. When teacher’s age is included the average increases by 0.5.
    A) Quantity I > Quantity II
    B) Quantity I ≥ Quantity II
    C) Quantity II > Quantity I
    D) Quantity II ≥ Quantity I
    E) Quantity I = Quantity II or Relation cannot be established

  2. Quantity I: Profit Percentage , if Some articles were bought at 6 articles for Rs. 5 and sold at 5 articles for Rs. 6.
    Quantity II: Profit Percentage, if 100 toys are bought at the rate of Rs. 350 and sold at the rate of Rs. 48 per dozen.
    A) Quantity I > Quantity II
    B) Quantity I ≥ Quantity II
    C) Quantity II > Quantity I
    D) Quantity II ≥ Quantity I
    E) Quantity I = Quantity II or Relation cannot be established

Sunday, November 12, 2017

DI (CAT/GMAT LEVEL) For IBPS PO MAINS 2017


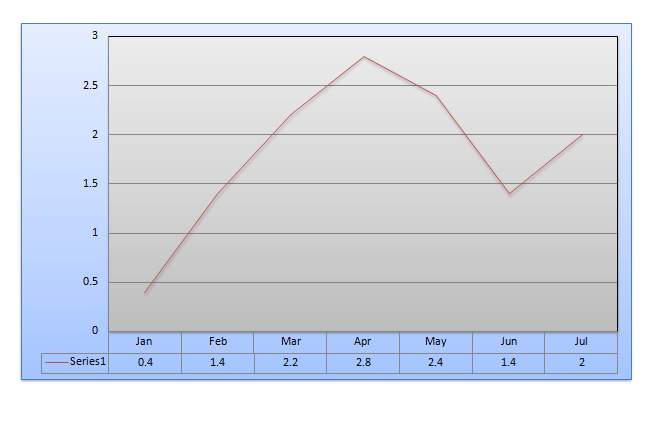
Directions (Q. Nos. 1-4) Refer to the following line graph which represents the rainfall in- inches during the months of January through July in a particular year in a certain city
line-graph-data-interpretation-level-2-set-1


In each of these questions, two quantities are given, one in  and one in . Compare the two quantities.
Mark answer as
(a) If the two quantities are equal
(b) If the quantity in  is greater
(c) If the quantity in  is greater
(d) If the relationship cannot be determined from the information given